

Interstate corridors and certain rural arterials account for most of Georgia’s highest-risk stretches, notably I-20, I-75, and parts of I-285, along with US-78, GA-85, Moreland Avenue, and the SR-42 segment identified by MoneyGeek’s analysis. Risk concentrates around merging interchanges and narrow rural roads. Before you drive these routes, check the GDOT Crash Data Dashboard for current crash patterns near you.
TL;DR:
- Most fatal crashes in Georgia occur along busy interstates like I-20, I-75, and I-285, especially at merging points and congested interchanges.
- Rural two-lane arterials also pose high fatality risks due to high speeds, limited shoulders, and absence of median separation, despite fewer total crashes.
- Behavioral factors such as speeding, distracted or impaired driving, and low seatbelt use most greatly influence crash risk on these high-risk roads.
- Infrastructure issues, like short ramps, narrow lanes, and frequent weaving zones, increase the chance of serious accidents, especially at high speeds.
- Checking current crash patterns on the GDOT dashboard helps drivers identify and avoid specific dangerous segments before traveling.
Table of Contents
- 1. The most dangerous roads and segments statewide
- 2. Metro Atlanta hotspots: why I-285, I-75 and I-20 stand out
- 3. Why these roads are dangerous: behavioral and engineering causes
- 4. Where to check crash maps and official data
- 5. Practical safety steps drivers should use on high-risk Georgia roads
- 6. Recent statewide fatality totals and trend context
- 7. Historical changes and improvements on dangerous roads in Georgia
- 8. How weather conditions raise road danger levels in Georgia
- 9. Demographic factors contributing to accident risk on these roads
- 10. Emergency response and hospital access near dangerous road segments
- Publisher perspective: why local crash hotspots matter to us
- If you were injured on a dangerous Georgia road, here is what to expect
- Sources
- FAQ
1. The most dangerous roads and segments statewide
Georgia’s crash data points to a consistent group of roads that show up year after year in fatality reports and safety studies. Here is where the risk concentrates and why each one earns its place on the list.
- SR-42 (S. River Industrial Blvd SE to Wylie St. SE): identified by MoneyGeek as Georgia’s deadliest stretch — with 12 fatal accidents recorded between 2018 and 2020.
- I-20 (metro Atlanta through DeKalb County): heavy commuter volume mixed with industrial truck traffic creates persistent congestion and fatal crash clusters.
- I-75 (northbound through Clayton and Henry Counties): one of the state’s highest-volume freight corridors, with sections that GDOT planning documents describe as carrying crash rates above the statewide average.
- I-285 (northern arc, the Perimeter): weaving lanes and closely spaced interchanges make this one of metro Atlanta’s most congested and crash-prone loops.
- US-78 (DeKalb and Gwinnett Counties): a mixed-use arterial with frequent turning conflicts and pedestrian exposure near commercial corridors.
- Georgia Highway 85 (Clayton and Fayette Counties): a high-speed suburban arterial where rear-end and angle crashes cluster near signalized intersections.
- Moreland Avenue (Atlanta): a dense urban corridor where pedestrian and cyclist crashes add to vehicle-on-vehicle risk.
- Rural two-lane arterials statewide: fewer total crashes than interstates, but the Georgia SHSP notes these roads carry disproportionately high fatality rates due to higher speeds and limited shoulders.
Each of these corridors appears repeatedly in state crash data, but the reasons differ: some are choked with volume, others punish a single mistake at high speed. Checking the segment nearest you on the GDOT dashboard gives a clearer, current picture than any static list can.
2. Metro Atlanta hotspots: why I-285, I-75 and I-20 stand out
Atlanta’s core interstates carry the state’s heaviest traffic, and that volume shows up directly in crash clustering. A spatio-temporal study of I-285 found that the northern half of the Perimeter contains multiple high-crash clusters, with merging and weaving segments showing the strongest statistical link to crash frequency.
- I-285 northern arc: interchange spacing forces frequent lane changes in short distances, a pattern the spatial-cluster research ties directly to elevated crash counts.
- I-75 northbound: GDOT planning documents flag sections through the southern metro as priorities for safety improvements due to crash rates that exceed the statewide average.
- I-20 through DeKalb County: fatality patterns cluster around industrial access points and merge zones where freight and commuter traffic mix.
The crash types differ by location, but a pattern holds across all three: rear-end collisions dominate in stop-and-go congestion, while sideswipe and merging crashes spike wherever ramps are closely spaced.
3. Why these roads are dangerous: behavioral and engineering causes
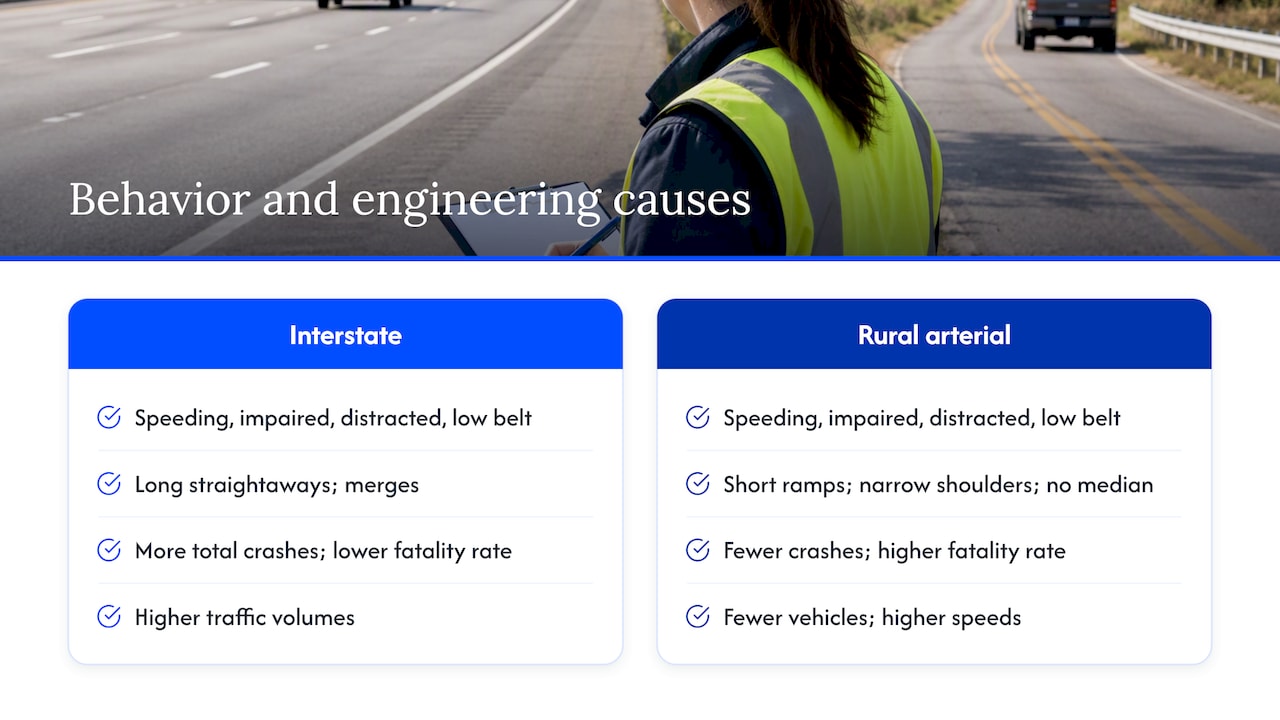
Two forces drive Georgia’s crash patterns, and they often overlap on the same stretch of road. On the behavioral side, the Georgia SHSP names speeding, impaired driving, distracted driving, and low seatbelt use as the state’s top emphasis areas. These behaviors do not distribute evenly. They cluster on roads where design invites them, like long straightaways that tempt speeding or congested merges that tempt distracted lane changes.
On the engineering side, merging and weaving lanes, short entrance and exit ramps, narrow shoulders, and two-lane rural roads with no median separation all raise the odds that a single error becomes a serious crash. This is why the GDOT/FHWA HSIP process uses Empirical Bayes estimation rather than raw counts. Rural arterials often show fewer total crashes than interstates but a higher fatality rate, because there are fewer vehicles on the road to begin with and each crash happens at higher speed.
4. Where to check crash maps and official data
If you want to verify any of these hotspots for yourself before a trip, three public resources cover the ground.
- GDOT Crash Data Dashboard: maps five years of crash data statewide, filterable by city, county, and crash type, so you can search a specific road segment directly.
- GOHS and the Georgia SHSP: report statewide fatality totals, emphasis areas, and the safety campaigns tied to them.
- HSIP reports: show which corridors GDOT has prioritized for engineering fixes based on data-driven crash analysis rather than public perception.
A single bad year on a short stretch can skew a raw count. Look at multi-year maps and rate-based data rather than one year’s total when deciding how risky a road really is.
5. Practical safety steps drivers should use on high-risk Georgia roads
Small habits make an outsized difference on the corridors covered above. Georgia’s high-crash roads punish the same mistakes over and over, so avoiding them consistently is the most reliable protection you have.
- Adjust your speed for traffic density and weather, not just the posted limit.
- Increase following distance on interstates prone to sudden braking, like I-285 and I-75.
- Put the phone away before merging zones, where a split-second lane change often decides the outcome.
- Buckle up every trip. Georgia’s SHSP lists low restraint use as a priority safety issue.
- Never drive impaired. Impaired driving remains one of the state’s top emphasis areas.
- Choose an alternate route around known bottlenecks when your schedule allows it.
Pro Tip: Signal early and match your speed to merging traffic well before an interchange rather than at the last second: most weaving crashes happen in the final few hundred feet before a ramp.
If you notice a recurring hazard such as a faded lane marking or a malfunctioning signal, Georgia drivers can report it to GDOT, which feeds into the same data that shapes future safety projects.
6. Recent statewide fatality totals and trend context
Georgia recorded 1,422 motor vehicle traffic fatalities in 2024, a 12% decrease from the 1,615 fatalities recorded in 2023, according to preliminary GOHS data. That decline follows several years in which fatality totals climbed above pre-pandemic levels, a pattern seen in many states as traffic volumes rebounded.
The drop matters, but it does not mean the roads covered above have become safe. A statewide decrease can mask persistent risk on specific corridors, especially where local crash counts remain flat while the state average falls. Rural arterials and local roads continue to show elevated fatality rates relative to the vehicle miles traveled on them, a pattern federal crash reporting has documented for years.
Reading a single year’s total without context can mislead you either way. That consistency, more than any single year’s number, is what makes a road worth extra caution.
7. Historical changes and improvements on dangerous roads in Georgia
GDOT does not treat its most dangerous corridors as fixed. The HSIP process exists specifically to identify high-crash locations and fund engineering countermeasures, from extended merge lanes to improved lighting and signal timing. Corridors flagged as high-priority in one HSIP cycle often see measurable design changes within a few years.
I-75’s southern metro sections, for example, have been the subject of GDOT environmental assessments and planning studies aimed at addressing crash rates above the statewide average. Interchange redesigns, added lanes, and ramp reconfigurations are the typical outcomes of that process once a corridor is prioritized.
Rural arterials have seen a different kind of change: targeted enforcement and outreach campaigns layered on top of infrastructure fixes. GOHS has emphasized combining engineering improvements with enforcement and public education, particularly on rural principal arterials where fatality rates run highest.
None of this means the risk disappears. A corridor that received safety funding five years ago can still rank among the state’s more dangerous roads today, especially if traffic volume has grown faster than the infrastructure around it. The dashboards and reports covered earlier in this article are the most reliable way to see whether a specific improvement actually moved the numbers on a road you use.
8. How weather conditions raise road danger levels in Georgia
Georgia’s mix of heavy summer rain, occasional winter ice, and dense fog in low-lying areas adds a layer of risk on top of the corridors already prone to crashes. Wet pavement extends stopping distances and reduces tire grip, which turns an already tight merge on I-285 or I-75 into a higher-stakes maneuver.
Rural two-lane roads carry their own weather risk profile. Narrow shoulders and limited lighting mean a driver who hydroplanes or loses traction on a curve has less room to recover than on a wide interstate. Fog is a particular concern in low-lying stretches of south Georgia, where visibility can drop suddenly on roads that already have limited passing room.
Winter weather events are rare in Georgia compared to northern states, but that rarity is part of the danger. Drivers and road surfaces alike are less prepared for ice, and a single freezing morning can produce a disproportionate spike in crashes on bridges and overpasses that freeze before the rest of the roadway.
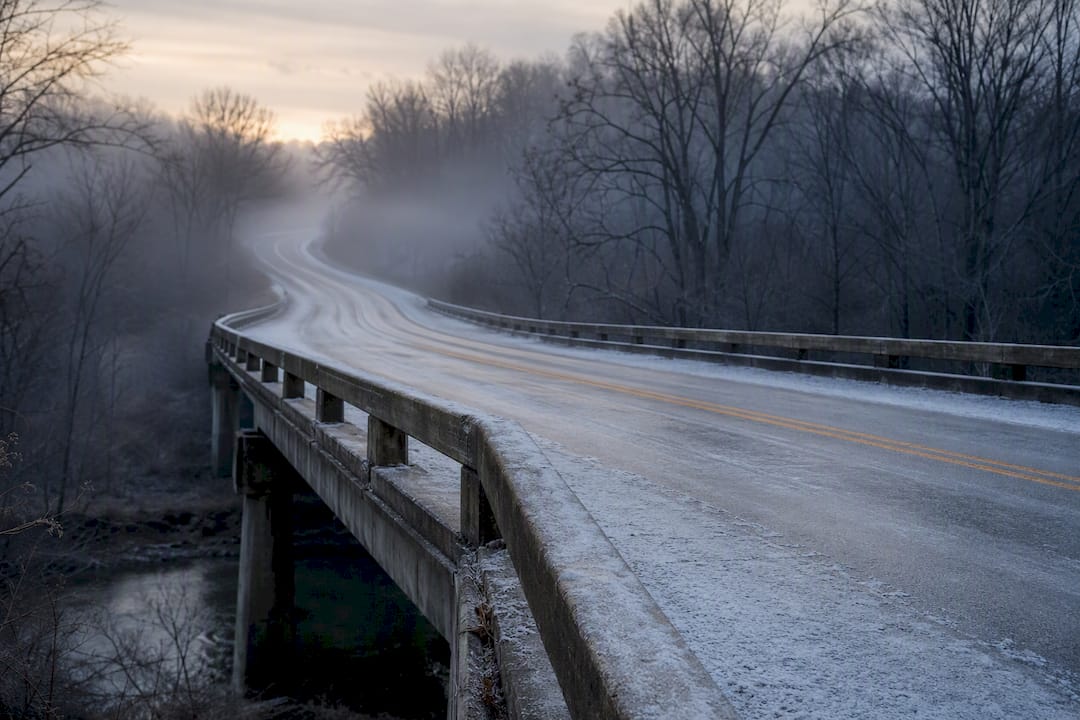
The practical takeaway is straightforward: treat posted speed limits as a ceiling, not a target, whenever rain, fog, or freezing temperatures are in the forecast, especially on the merging-heavy interstates and narrow rural roads named earlier in this article.
9. Demographic factors contributing to accident risk on these roads
Crash risk on Georgia’s most dangerous roads is not distributed evenly across every driver. Younger and less experienced drivers are statistically more likely to be involved in the kinds of speeding and distraction-related crashes that the Georgia SHSP names as priority emphasis areas. Commercial truck drivers, meanwhile, log disproportionate hours on freight-heavy corridors like I-75 and I-20, which raises their exposure to the fatigue and merging risks common on those routes.
Pedestrians and cyclists face a different risk profile on urban arterials like Moreland Avenue and US-78, where commercial density brings foot traffic into close contact with turning vehicles. Older adults, who may have slower reaction times, are also overrepresented in crashes at complex interchanges where quick merging decisions are required.
None of these factors operate in isolation. A young driver commuting on I-285 during peak congestion faces a different risk mix than a commercial trucker on I-75 at night or a pedestrian crossing Moreland Avenue near a commercial strip. Understanding which group you fall into, and adjusting your habits accordingly, is part of driving these roads responsibly.
10. Emergency response and hospital access near dangerous road segments
How quickly emergency crews can reach a crash scene, and how close the nearest trauma center is, shapes outcomes on Georgia’s highest-risk corridors. Metro Atlanta’s interstates, including I-285, I-75, and I-20, sit within reach of multiple Level I trauma centers, which shortens transport times for the most severe crashes.
Rural arterials tell a different story. A crash on a two-lane road far from a hospital can mean a longer wait for advanced care, which compounds the risk already created by higher rural speeds and narrower shoulders. This gap between urban and rural emergency access is one reason rural crashes often carry worse outcomes even when the initial collision looks similar to one on a city interstate.
Congestion itself can also slow emergency response on the busiest interstates. A multi-vehicle crash on I-285 during rush hour can trap ambulances behind the same traffic that caused the crash, adding minutes that matter in a serious injury case. That reality underscores why prevention, not just response time, remains the more reliable protection on these roads.
Publisher perspective: why local crash hotspots matter to us
We handle auto accident and trucking accident cases on a contingency-fee basis, with free consultations available. Watching where crashes cluster on roads like I-20 and I-285 shapes how we advise clients in the hours after a wreck: preserve the crash report, photograph the scene, and get medical documentation early. If you were seriously hurt on any of these corridors, prompt legal advice protects evidence that fades fast.
— Ali
If you were injured on a dangerous Georgia road, here is what to expect

A crash on I-20, I-75, or any of the roads covered here can leave you facing medical bills and lost income while you are still recovering. The Jewkes Firm reviews auto accident, trucking accident, and related personal injury claims for South Atlanta and surrounding Georgia counties, and we work on a contingency-fee basis, meaning you pay nothing unless we recover for you. Consultations are free. If you were hurt on one of the roads named in this article, reach out and let us walk through your options with you.
Sources
- Most deadly roads in Georgia — MoneyGeek (2024)
- GDOT Crash Data Dashboard — crash manual / data
- Georgia Strategic Highway Safety Plan (SHSP 2022–24)
- Georgia HSIP report (FHWA, 2024)
FAQ
What is the deadliest road in Georgia?
A 2024 MoneyGeek analysis identified the SR-42 stretch between S. River Industrial Boulevard SE and Wylie Street SE as Georgia’s deadliest, with 12 fatal accidents recorded between 2018 and 2020. Interstate corridors like I-20 and I-75 also show consistently high crash activity in state data, but they carry far higher traffic volumes.
What are the most dangerous roads and highways in Georgia?
Georgia’s highest-risk corridors include I-20, I-75, I-285, US-78, Georgia Highway 85, and Moreland Avenue, alongside the SR-42 stretch identified by MoneyGeek. You can check current crash patterns for any of these on the GDOT Crash Data Dashboard.
Which part of Georgia has the roughest roads?
Metro Atlanta’s interstate network, particularly the northern arc of I-285 and sections of I-75 and I-20, shows the heaviest crash clustering due to congestion and closely spaced interchanges. Rural arterials elsewhere in the state show fewer total crashes but higher fatality rates, as the Georgia SHSP notes for roads with higher speeds and narrower shoulders.
What is the deadliest road in the United States?
National rankings of the deadliest roads vary by methodology and change from year to year, so no single road holds a fixed, universally agreed title. For a Georgia-specific answer grounded in state data, the GDOT Crash Data Dashboard and the SR-42 finding from MoneyGeek are the most reliable places to start.
How can I check crash data for a specific Georgia road?
The GDOT Crash Data Dashboard lets you search by city, county, crash type, and timeframe across a five-year window. Looking at multi-year patterns rather than a single year’s total gives a clearer picture of whether a road is consistently dangerous.