
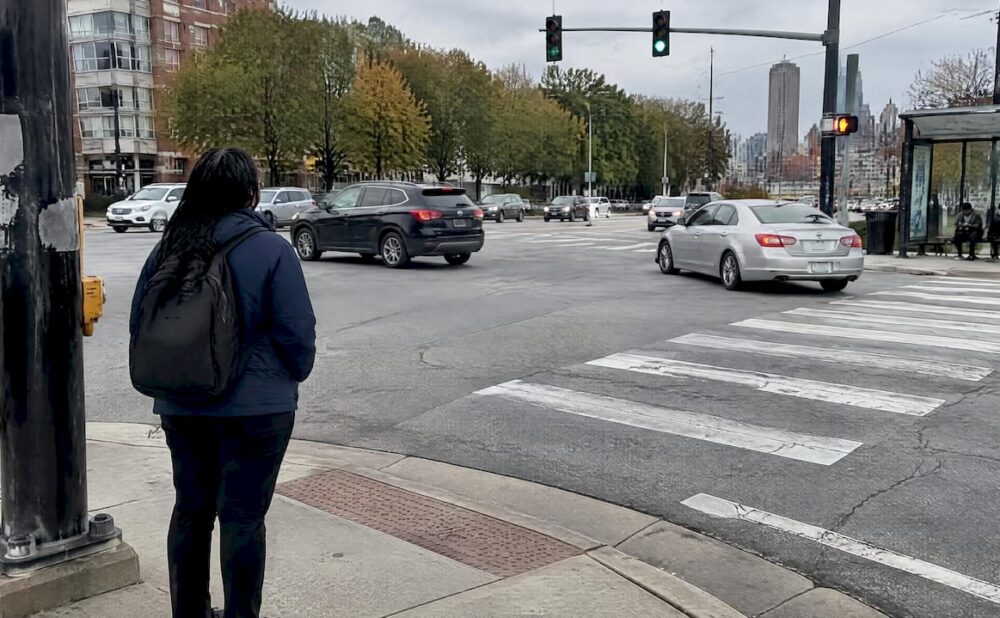
This page lists the Atlanta intersections where official crash data shows the highest concentration of serious and fatal crashes, drawn from the City of Atlanta’s Vision Zero Action Plan and GDOT’s crash records. If you or a loved one were hurt at one of these locations, we’re ready to talk through what happened and what comes next.
Summary:
- The highest-risk intersections include Cleveland Avenue at Metropolitan Parkway and Northside Drive at Marietta Street, due to complex design flaws and heavy traffic.
- Common risk factors involve wide lanes, high speeds, frequent turning conflicts, and limited pedestrian infrastructure, which amplify crash likelihood.
- Verifying crash data is possible via the city’s dashboard and GDOT’s crash portal, with the latter weighting severe crashes more heavily in danger rankings.
- Simple habits like slowing down early, waiting for protected turns, and using crosswalks can significantly reduce individual crash risks.
- Many safety improvements, such as pedestrian scrambles and road diets, depend on community input, funding, and engineering timelines, with outcomes tracked over several years.
Table of Contents
- 1. Atlanta’s highest-risk intersections, named
- 2. Why Atlanta intersections concentrate crash risk
- 3. Where this data comes from and how to check it yourself
- 4. What drivers, pedestrians, and cyclists can do right now
- 5. Recent and planned projects aimed at reducing intersection risk
- 6. How crash rates at these intersections have shifted over time
- 7. The most common crash types at Atlanta’s riskiest intersections
- 8. When Atlanta intersections get most dangerous
- 9. How dangerous intersections affect pedestrians and cyclists differently
- Why this data matters to Atlanta residents
- If you were hurt at one of these intersections, we can help
- FAQ
- Sources
1. Atlanta’s highest-risk intersections, named
The city’s High Injury Network points to a handful of intersections that show up again and again in crash records, planning documents, and local reporting. Each one carries its own mix of design flaws and driver behavior that make a crash more likely.
- Cleveland Avenue at Metropolitan Parkway: wide, multi-lane approaches and heavy truck and bus traffic combine with limited pedestrian infrastructure, and this intersection sits on the city’s High Injury Network.
- Northside Drive at Marietta Street: complex turning movements near highway ramps create frequent conflict points between through traffic and vehicles merging or exiting.
- Campbellton Road at Barge Road: long, uncontrolled pedestrian crossing distances and higher travel speeds on Campbellton Road raise the risk for anyone on foot.
- Metropolitan Parkway at University Avenue: another corridor segment on the Vision Zero Action Plan’s High Injury Network, with frequent rear-end and turning crashes tied to commercial driveway access.
- Ponce de Leon Avenue at Clifton Road: a busy commuter cut-through near hospitals and universities, where pedestrian volume collides with drivers trying to beat congestion.
- Memorial Drive corridor crossings: several signalized crossings along Memorial Drive share the same pattern of wide lanes and long pedestrian exposure time.
- Moreland Avenue at McLendon Avenue: a high-traffic neighborhood crossing where visibility and turning conflicts have drawn repeated safety attention.
- Peachtree Street at North Avenue: dense foot traffic near MARTA access mixes with vehicles accelerating off a signal, a combination the city has flagged for pedestrian risk.
These are not the only risky spots in the city, but they recur across Vision Zero’s High Injury Network mapping and in local crash reporting, which makes them a reasonable starting point for anyone trying to understand where Atlanta’s crash risk concentrates.
2. Why Atlanta intersections concentrate crash risk
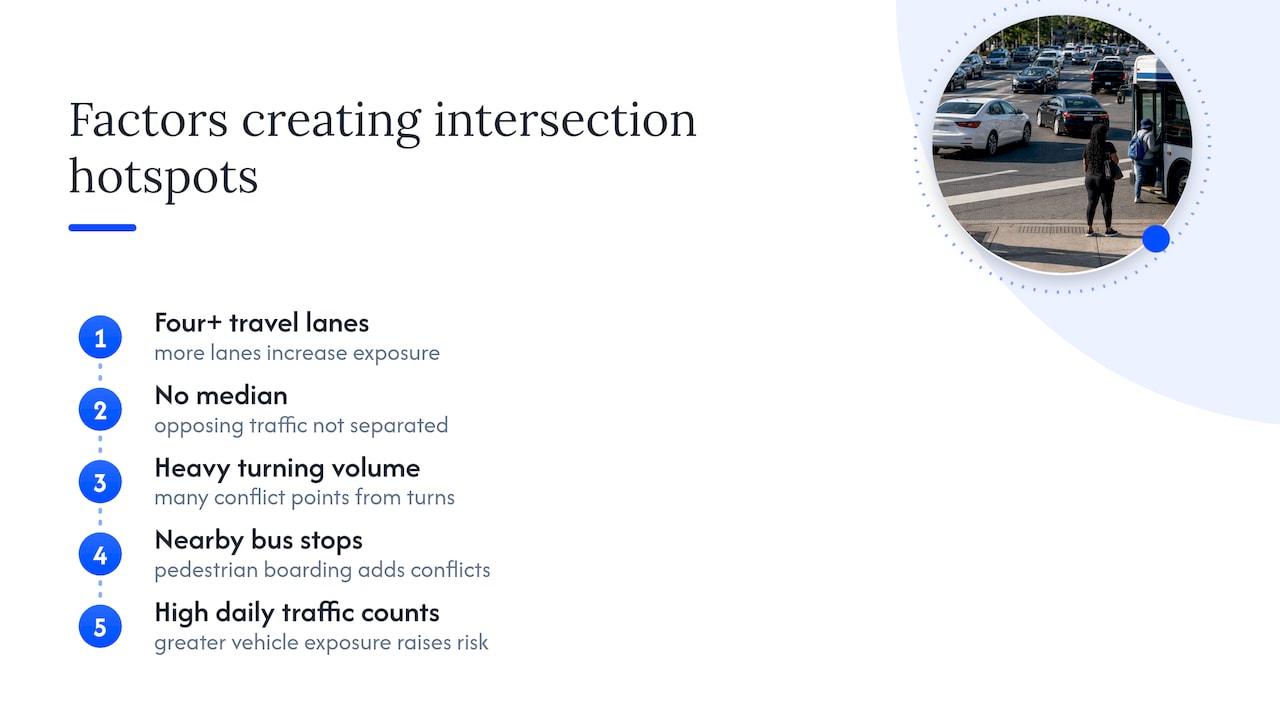
A small set of physical features shows up over and over at the city’s worst intersections: four or more travel lanes, no median to separate opposing traffic, heavy turning volume, nearby bus stops, and high average daily traffic counts. Each factor on its own raises risk. Stacked together, they turn an ordinary intersection into a hotspot.
Speeding and aggressive driving make each one of those factors worse. A driver running a yellow light at 45 miles per hour on a six-lane road leaves pedestrians and crossing vehicles almost no margin for error.
A relatively small number of intersections account for a disproportionate share of Atlanta’s serious crashes, according to the Vision Zero Action Plan’s crash analysis. That concentration is exactly why the city built a High Injury Network instead of treating every street the same way.
3. Where this data comes from and how to check it yourself
Every claim on this page traces back to public sources you can search yourself. The city’s High Injury Network is the backbone of the Vision Zero Action Plan, which identifies the corridors and intersections responsible for a large share of Atlanta’s fatal and serious injury crashes and recommends fixes like leading pedestrian intervals, right-turn-on-red restrictions, and road diets.
To verify any of it:
- Visit the ATLDOT Vision Zero dashboard and search by address to see nearby crash points plotted on a map.
- Filter results by injury severity or travel mode (pedestrian, bicycle, vehicle) to isolate the crash types that matter to you.
- Switch to the heat map view to see concentration patterns across the whole city rather than one intersection at a time.
- Cross-check state-owned roads using the GDOT crash data portal, which covers the prior five years of crash reports.
GDOT also uses a weighted metric called ePDO, or equivalent property damage only, which gives more weight to severe and fatal crashes than to minor fender-benders. That weighting can shift which intersections rank as “most dangerous” compared to a simple crash count.
4. What drivers, pedestrians, and cyclists can do right now
Small habit changes make a real difference at intersections with the risk factors described above.
- Slow down well before the intersection, especially on multi-lane roads without a median.
- Scan both directions and mirrors before entering any intersection, not just when a light changes.
- Avoid permissive left turns during congestion: wait for a protected arrow when traffic is heavy.
- Increase following distance approaching intersections with a history of rear-end crashes.
- Use marked crosswalks and wait for the walk signal, even when traffic looks clear.
- Make eye contact with drivers before stepping or riding into a crossing, and avoid midblock crossings entirely.
Pro Tip: At intersections with permissive left-turn signals, position yourself a few seconds behind the first car in line rather than beside it, so oncoming traffic has a clear line of sight to you before you commit to the turn.
5. Recent and planned projects aimed at reducing intersection risk
The city’s toolkit for fixing dangerous intersections leans on a handful of proven countermeasures:
- Leading pedestrian intervals, which give people a head start crossing before vehicles get a green light.
- Right-turn-on-red restrictions at crossings with heavy pedestrian volume.
- Protected left-turn phases to remove the guesswork from permissive turns.
- Road diets, which narrow or remove travel lanes to slow traffic and shorten crossing distances.
- Pedestrian scrambles, which stop all vehicle traffic at once so pedestrians can cross in any direction.
A pedestrian scramble pilot at 10th Street and Piedmont Avenue has tested this last approach in a high foot-traffic area, and corridor work along Metropolitan Parkway has included bike lane and intersection upgrades tied to the city’s broader Vision Zero push. Most of these projects depend on funding cycles, engineering studies, and community input, so timelines vary widely from one corridor to the next.
6. How crash rates at these intersections have shifted over time
Atlanta’s current High Injury Network draws heavily on crash data gathered between 2017 and 2021, and the Vision Zero Action Plan built on that multi-year window specifically because single-year snapshots can be misleading. A quiet year on a dangerous corridor doesn’t mean the underlying risk went away, and a bad year doesn’t always signal a new problem.
What tends to hold steady across years is the list of contributing factors: wide, high-speed roads with no median, heavy turning movement, and limited pedestrian infrastructure keep showing up at the same locations year after year. That consistency is part of why city planners built a standing network of high-injury corridors instead of chasing whichever intersection had the worst headline number last year.
Where the city has made physical changes, such as adding protected turn phases or narrowing lanes through a road diet, the underlying design factors driving risk improve, which is the entire logic behind Vision Zero’s countermeasure-first approach. Where no changes have been made, the same intersections tend to keep reappearing in crash reports, reinforcing their place on the High Injury Network rather than falling off it.
7. The most common crash types at Atlanta’s riskiest intersections
Not every dangerous intersection fails in the same way. Rear-end collisions cluster at locations with heavy congestion and abrupt braking, often tied to a nearby signal, bus stop, or merge point. Side-impact crashes, sometimes called T-bone collisions, show up most at intersections with permissive left turns or confusing signal phasing, where a driver misjudges a gap in oncoming traffic.
Pedestrian and bicycle collisions are the crash type city planners worry about most, because they account for a disproportionate share of fatal and serious injury outcomes relative to how often they occur, according to the Vision Zero Action Plan’s crash summary. A rear-end crash between two vehicles often ends in property damage and minor injury. A vehicle striking a pedestrian or cyclist at the same intersection is far more likely to cause a life-changing injury or death.
That distinction shapes which fixes the city prioritizes. Protected left-turn phases target side-impact crashes directly, while leading pedestrian intervals and scrambles target the pedestrian and cyclist collisions that carry the highest severity. Understanding which crash type dominates at a given intersection helps explain why one fix gets chosen over another.
8. When Atlanta intersections get most dangerous
Crash risk at these intersections isn’t evenly spread across the day. Morning and evening rush hours bring the heaviest traffic volume, more turning conflicts, and more drivers rushing to beat a light, all of which raise the odds of a crash. GDOT’s safety engineering staff have pointed to higher rates of reckless driving in Atlanta compared with other parts of the state, a factor that compounds with rush-hour volume rather than replacing it, according to GDOT crash data cited by WSB-TV.
Weather adds another layer. Rain reduces visibility and lengthens stopping distance, which matters most at intersections already dealing with high speeds and no median separation. Darkness compounds the danger for pedestrians specifically, since many of Atlanta’s highest-risk crossings have limited lighting relative to their traffic volume.
Weekend nights carry their own risk profile, often tied to impaired driving rather than congestion. The combination of lower traffic volume but higher speeds and higher impairment rates can make an otherwise quiet intersection just as dangerous as one jammed with rush-hour traffic, just for different reasons. Recognizing which conditions apply on a given drive, whether that’s a rainy Tuesday commute or a Saturday night, helps explain why the same intersection can feel manageable one day and hazardous the next.
9. How dangerous intersections affect pedestrians and cyclists differently
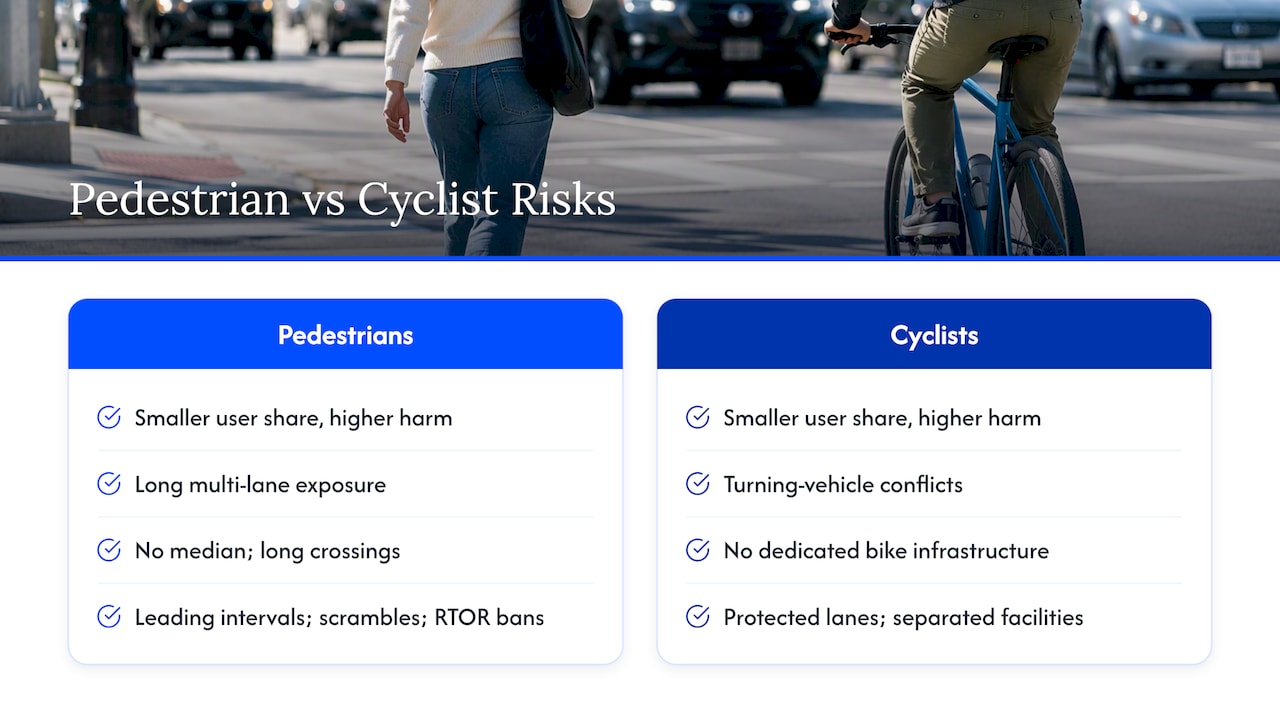
Pedestrians and cyclists absorb a disproportionate share of the harm at Atlanta’s highest-risk intersections, even though they make up a smaller share of total road users passing through them. Wide, multi-lane crossings with no median force pedestrians to cross more lanes of traffic without a safe place to pause, which extends exposure time at exactly the intersections where vehicle speeds tend to be highest.
Cyclists face a related but distinct problem: many of the city’s riskiest intersections were not built with dedicated bike infrastructure, which puts cyclists in the same travel lanes as turning vehicles. A driver making a right turn who isn’t scanning for a cyclist in the bike lane or shoulder is a recurring conflict type at several locations on the High Injury Network.
This is part of why the city’s countermeasure list leans so heavily on pedestrian-specific fixes like leading pedestrian intervals, scrambles, and right-turn-on-red restrictions rather than generic traffic-calming measures. A road diet that slows vehicle speeds helps everyone, but it does little to shorten a pedestrian’s exposure time crossing six lanes. Protecting vulnerable road users usually takes a different, more targeted fix than protecting vehicle occupants, and the city’s project list reflects that split.
Why this data matters to Atlanta residents
We believe the most useful thing a resident can do with this data is simple: look up the intersections you actually drive, walk, or bike through, and bring that information to a community meeting or a city council session if something looks wrong. Public dashboards exist precisely so you don’t have to take anyone’s word for it.
— Jordan M. Jewkes
If you were hurt at one of these intersections, we can help
We represent people injured in auto, pedestrian, bicycle, and trucking crashes in Atlanta and Georgia counties, including crashes at various intersections throughout the area.
We offer consultations and work on a contingency fee basis, so you pay only if we recover compensation for you. If you or someone you love was hurt at a dangerous Atlanta intersection, visit our practice areas page to see how we can help and to start a free case review.
FAQ
What part of Atlanta should drivers be most cautious in?
Corridors on the city’s High Injury Network, including stretches of Metropolitan Parkway, Campbellton Road, and Moreland Avenue, see a disproportionate share of serious crashes according to the Vision Zero Action Plan. Checking the ATLDOT dashboard for your specific route gives a more precise picture than any general neighborhood warning.
What are the deadliest intersections in the US?
National rankings of the deadliest intersections vary by methodology and year, and no single list is universally recognized as definitive. The NHTSA FARS database tracks fatal crash data nationwide and is the most reliable way to compare locations across cities and states.
What is the most famous street in Atlanta?
Peachtree Street is widely considered Atlanta’s most recognizable street, running through downtown and several of the city’s busiest commercial districts. It also intersects with some locations that appear on the city’s pedestrian safety radar, including the crossing at North Avenue.
Does Atlanta have bad traffic?
Atlanta is known for heavy congestion, especially during morning and evening rush hours, and GDOT officials have noted higher rates of reckless driving in the city compared with other parts of Georgia, according to crash data reported by WSB-TV. That combination of volume and aggressive driving is part of why certain intersections see repeated serious crashes.
How can I check crash history for a specific Atlanta intersection?
The ATLDOT Vision Zero dashboard lets you search by address and filter by injury severity or travel mode. For state-owned roads, the GDOT crash data portal covers the prior five years of crash reports and can corroborate what you find on the city dashboard.